empty
17.11.2022 01:34 PM
Technical analysis of EUR/USD for November 17, 2022

This image is no longer relevant

Overview :

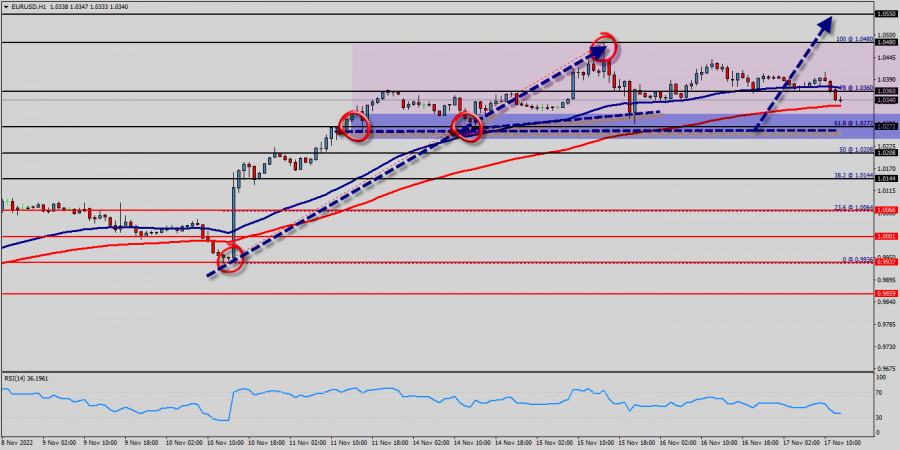
The EUR/USD pair's rise from 1.0272 is still in progress and intraday bias stays on the upside for 1.0272 resistance first on the one-hour chart. All elements being clearly bullish market, it would be possible for traders to trade only long positions on the EUR/USD pair as long as the price remains well above the price of 1.0272. The EUR/USD pair will continue rising from the level of 1.0272 in the long term. It should be noted that the support is established at the level of 1.0272 which represents the daily pivot point. The price is likely to form a double bottom in the same time frame. Accordingly, the EUR/USD pair is showing signs of strength following a breakout of the highest level of 1.0340. This suggests that the pair will probably go up in coming hours.

If the trend is able to break the level of 1.0340, then the market will call for a strong bullish market towards the objectives between 1.0272 ans 1.0480 this week. Currently, the price is in a bullish channel. This is confirmed by the RSI indicator signaling that we are still in a bullish trending market. As the price is still above the moving average (100), immediate support is seen at 1.0272, which coincides with a key ratio (61.8% of Fibonacci). The EUR/USD pair swing around the breached resistance of the bullish channel and keeps its stability above it until now, noticing that the EMA50 continues to resistance the price from above, while RSI begins to overlap positively.

Thus, the market is indicating a bullish opportunity above the above-mentioned support levels, for that the bullish outlook remains the same as long as the 100 EMA is headed to the upside. So, buy above the level of 1.0340 with the first target at 1.0360 in order to test the daily resistance 1. The buyers' bullish objective is set at the level of 1.0480. A bullish break in this resistance would boost the bullish momentum. The buyers could then target the resistance located at 1.0480. If there is any crossing, the next objective would be the resistance located at 1.0480. The level of 1.0550 is a good place to take profits.

Moreover, the RSI is still signaling that the trend is upward as it remains strong above the moving average (100). However, beware of bullish excesses that could lead to a possible short-term correction; but this possible correction would not be tradeable.

On the other hand, in case a reversal takes place and the EUR/USD pair breaks through the support level of 1.0272, a further decline to 1.0208 and 1.0144 can occur. It would indicate a bearish market.

Mourad El Keddani,
الخبير التحليلي لدى شركة إنستافوركس
© 2007-2025
حدد الإطار الزمني
5
د
15
د
30
د
1
س
4
ساعات
1
يوم
1
أسبوع
كسب عائد من تغيرات أسعار العملات المشفرة مع إنستافوركس.
قم بتحميل منصة التداول ميتاتريدر 4 وافتح أول صفقة.
  • Grand Choice
    Contest by
    InstaForex
    InstaForex always strives to help you
    fulfill your biggest dreams.
    انضم إلى المسابقة

المقالات الموصى بها

التوقعات لزوج الجنيه الإسترليني/الدولار الأمريكي في 31 مارس 2025

في الرسم البياني لكل ساعة، تداول زوج الجنيه الإسترليني/الدولار الأمريكي بشكل جانبي يوم الجمعة، لكن ارتدادين من مستوى 1.2931 يسمحان ببعض النمو المحتمل نحو مستوى التصحيح 127.2% فيبوناتشي عند 1.3003

Samir Klishi 12:28 2025-03-31 UTC+2

اليورو/الدولار الأمريكي. 31 مارس. الدولار ليس لديه فرصة

يوم الجمعة، استقر زوج اليورو/الدولار الأمريكي فوق منطقة 1.0781–1.0797، مما سمح باستمرار الحركة الصعودية نحو مستوى فيبوناتشي 200.0% عند 1.0857. الارتداد من هذا المستوى سيفضل الدولار الأمريكي ويؤدي إلى انخفاض

Samir Klishi 11:58 2025-03-31 UTC+2

توقعات الفوركس 31/03/2025: اليورو/الدولار الأمريكي، الجنيه الإسترليني/الدولار الأمريكي، الذهب، النفط والبيتكوين

روابط مفيدة: مقالاتي الأخرى متوفرة في هذا القسم دورة InstaForex للمبتدئين التحليلات الشائعة افتح حساب تداول مهم: يجب على المبتدئين في تداول الفوركس أن يكونوا حذرين للغاية عند اتخاذ القرارات

Sebastian Seliga 10:50 2025-03-31 UTC+2

تحليل فني لزوجي اليورو/الدولار الأمريكي والجنيه الإسترليني/الدولار الأمريكي في 31 مارس

خلال الأسبوع، حاول اللاعبون المتشائمون تأكيد التراجع الذي تشكل في وقت سابق ومواصلة الانخفاض لكنهم لم ينجحوا، مما أدى إلى ظهور ظل سفلي طويل على الشمعة الأسبوعية. وعادت الزوج

Evangelos Poulakis 09:07 2025-03-31 UTC+2

توقعات اليورو/الدولار الأمريكي ليوم 31 مارس 2025

مرة أخرى، سيطر الخوف على المشاركين في السوق بسبب نية واشنطن توسيع الرسوم الجمركية بنسبة 20% على جميع شركاء الولايات المتحدة التجاريين تقريبًا. يوم الجمعة، انخفض مؤشر الأسهم S&P

Laurie Bailey 05:20 2025-03-31 UTC+2

توقعات GBP/USD ليوم 31 مارس 2025

على الرسم البياني اليومي، يتحرك السعر داخل قناة صاعدة. إذا استمر التفاؤل، فقد يتم كسر مستوى الهدف عند 1.3184. مؤشر مارلين محايد عند خط الصفر، مما يترك مجالاً واسعاً للنمو

Laurie Bailey 05:13 2025-03-31 UTC+2

توقعات USD/JPY ليوم 31 مارس 2025

بعد انخفاض مؤشر S&P 500 بنسبة 1.97% يوم الجمعة، تراجع زوج الدولار الأمريكي/الين الياباني بمقدار 120 نقطة. هذا الصباح، انخفض مؤشر نيكاي 225 الياباني بنسبة 3.85%، ويفقد زوج الدولار الأمريكي/الين

Laurie Bailey 05:13 2025-03-31 UTC+2

توقعات النفط ليوم 31 مارس 2025

ظل خام النفط (CL) فوق خط القناة السعرية الخضراء الهابطة لمدة يومين فقط. وبعد انخفاضه بمقدار 84 سنتًا بحلول يوم الجمعة، انخفض السعر إلى ما دون هذا الخط في القناة

Laurie Bailey 05:13 2025-03-31 UTC+2

توقعات الفوركس 28/03/2025: اليورو/الدولار الأمريكي، الجنيه الإسترليني/الدولار الأمريكي، الدولار الأمريكي/الين الياباني، النفط والبيتكوين

روابط مفيدة: مقالاتي الأخرى متوفرة في هذا القسم دورة InstaForex للمبتدئين التحليلات الشائعة افتح حساب تداول مهم: يجب على المبتدئين في تداول الفوركس أن يكونوا حذرين للغاية عند اتخاذ القرارات

Sebastian Seliga 23:24 2025-03-28 UTC+2

إشارات التداول للذهب (XAU/USD) للفترة من 28 إلى 31 مارس 2025: البيع تحت مستوى 3,078 دولار (تصحيح تقني - 21 SMA)

في بداية الجلسة الأمريكية، يتداول الذهب حول 3,078، أقل من أعلى مستوى قياسي جديد بلغ حوالي 3,086 تم الوصول إليه خلال الجلسة الأوروبية. يحافظ الذهب على زخم صعودي. ومع ذلك،

Dimitrios Zappas 14:12 2025-03-28 UTC+2
لا تستطيع التحدث الآن؟
اطرح سؤالك في الدردشة.
Widget callback
 

Dear visitor,

Your IP address shows that you are currently located in the USA. If you are a resident of the United States, you are prohibited from using the services of InstaFintech Group including online trading, online transfers, deposit/withdrawal of funds, etc.

If you think you are seeing this message by mistake and your location is not the US, kindly proceed to the website. Otherwise, you must leave the website in order to comply with government restrictions.

Why does your IP address show your location as the USA?

  • - you are using a VPN provided by a hosting company based in the United States;
  • - your IP does not have proper WHOIS records;
  • - an error occurred in the WHOIS geolocation database.

Please confirm whether you are a US resident or not by clicking the relevant button below. If you choose the wrong option, being a US resident, you will not be able to open an account with InstaForex anyway.

We are sorry for any inconvenience caused by this message.