Forecast for February 13:
Analytical review of currency pairs on the scale of H1:
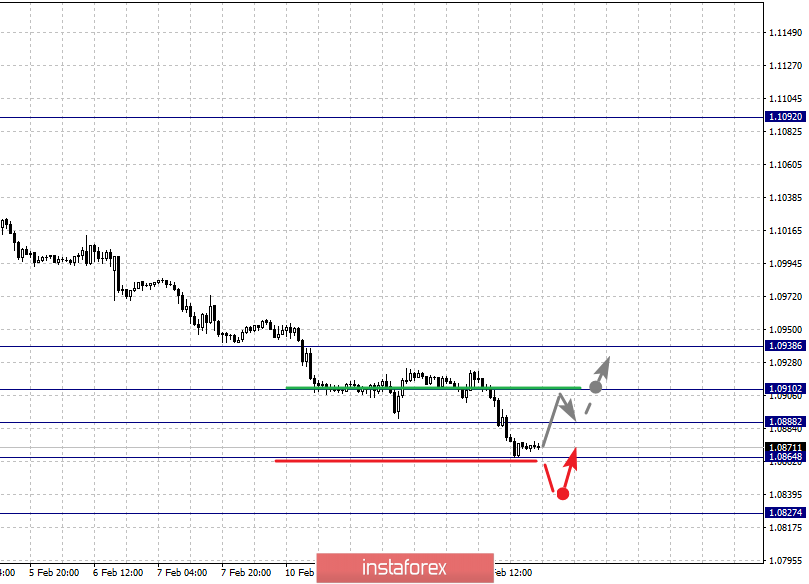
For the euro / dollar pair, the key levels on the H1 scale are: 1.0938, 1.0910, 1.0888, 1.0864 and 1.0827. Here, the price is near the limit values for the downward cycle, and therefore, we expect a correction. Short-term upward movement is expected in the range of 1.0888 - 1.0910. The breakdown of the latter value will lead to an in-depth correction. Here, the target is 1.0938. This level is a key support for the downward structure.
The breakdown of the level of 1.0864 will be accompanied by an unstable movement to the bottom. Here, the potential target is 1.0827, when this level is reached, we expect to go to the top.
The main trend is a downward structure from January 31, we expect a correction
Trading recommendations:
Buy: 1.0888 Take profit: 1.0910
Buy: 1.0912 Take profit: 1.0936
Sell: 1.0862 Take profit: 1.0845
Sell: Take profit:
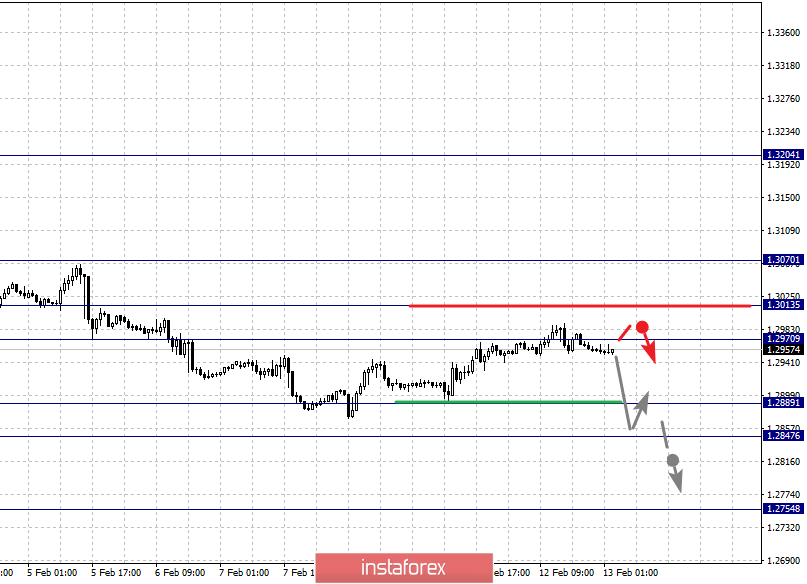
For the pound / dollar pair, the key levels on the H1 scale are: 1.3070, 1.3013, 1.2970, 1.2889, 1.2847 and 1.2754. Here, we are following the development of the downward structure of January 31. At the moment, the price is in correction. Short-term downward movement is expected in the range of 1.2889 - 1.2847. The breakdown of the last value should be accompanied by a pronounced movement to the bottom. In this case, the potential target is 1.2754. We expect consolidation, as well as a pullback to the top near this level.
Short-term upward movement is possibly in the range of 1.2970 - 1.3013. The breakdown of the latter value will lead to an in-depth correction. Here, the target is 1.3070. This level is a key support for the downward structure.
The main trend is the descending structure of January 31
Trading recommendations:
Buy: 1.2970 Take profit: 1.3011
Buy: 1.3015 Take profit: 1.3070
Sell: 1.2889 Take profit: 1.2848
Sell: 1.2845 Take profit: 1.2756
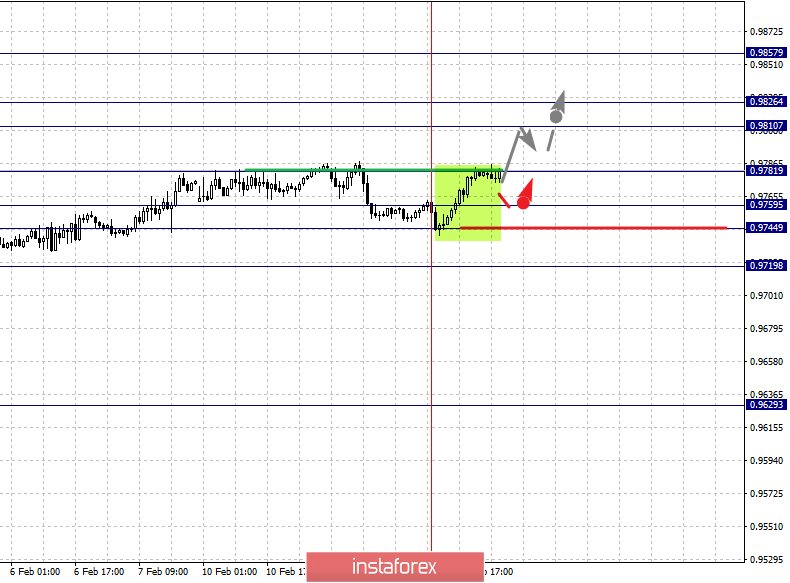
For the dollar / franc pair, the key levels on the H1 scale are: 0.9858, 0.9826, 0.9810, 0.9781, 0.9759, 0.9744 and 0.9719. Here, we are following the development of the ascending structure of January 31, and the price has formed a local potential for the top of February 12. The continuation of the movement to the top is expected after the breakdown of the level of 0.9781. In this case, the target is 0.9810. Price consolidation is in the range of 0.9810 - 0.9826. For the potential value for the top, we consider the level of 0.9858, upon reaching this value, we expect a pullback to the bottom.
Short-term downward movement is possibly in the range of 0.9759 - 0.9744. The breakdown of the latter value will lead to an in-depth correction. Here, the target is 0.9719. This level is a key support for the upward structure.
The main trend is the upward cycle of January 31, the local potential of February 12
Trading recommendations:
Buy : 0.9782 Take profit: 0.9810
Buy : 0.9826 Take profit: 0.9858
Sell: 0.9759 Take profit: 0.9745
Sell: 0.9742 Take profit: 0.9720
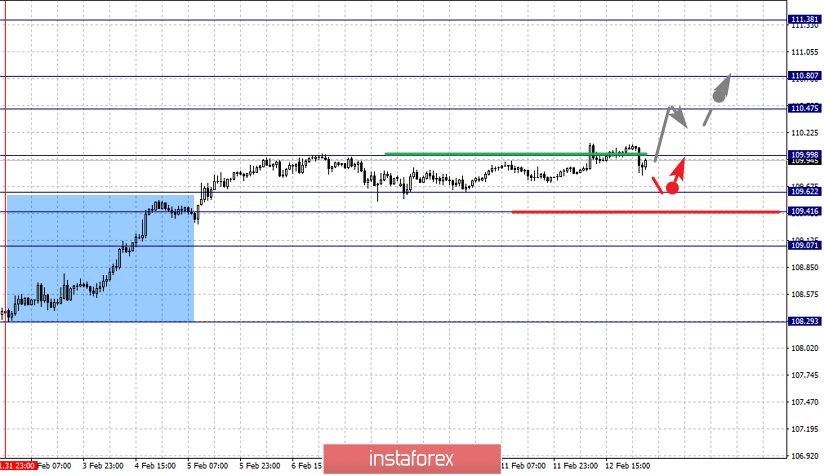
For the dollar / yen pair, the key levels on the scale are : 110.80, 110.47, 109.99, 109.62, 109.41 and 109.07. Here, we are following the development of the ascending structure of January 31. The continuation of the movement to the top is expected after the breakdown of the level of 110.00. In this case, the target is 110.47. Price consolidation is near this level. For the potential value for the top, we consider the level 110.80, upon reaching which, we expect a pullback to the bottom.
Short-term downward movement is possibly in the range of 109.62 - 109.41. The breakdown of the last value will lead to an in-depth correction. Here, the goal is 109.07. This level is a key support for the top.
Main trend: upward structure of January 31
Trading recommendations:
Buy: 110.00 Take profit: 110.45
Buy : 110.49 Take profit: 110.80
Sell: 109.60 Take profit: 109.42
Sell: 109.38 Take profit: 109.10
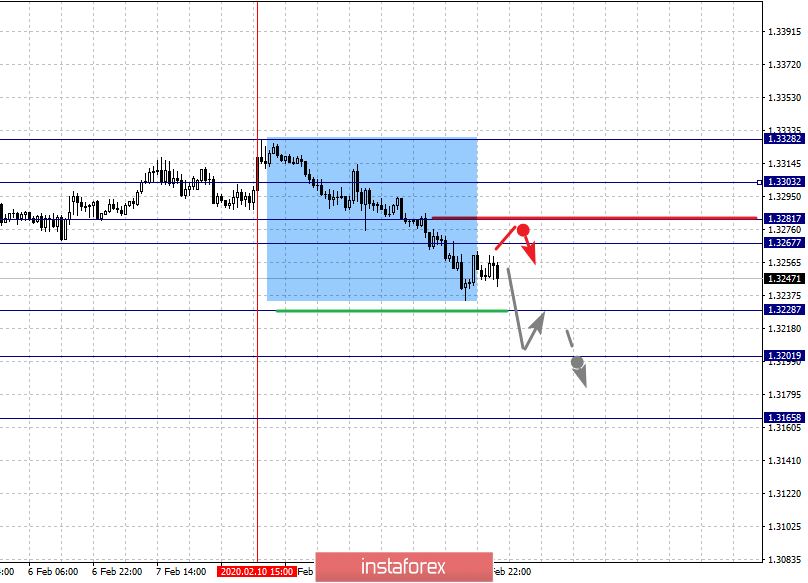
For the Canadian dollar / US dollar pair, the key levels on the H1 scale are: 1.3303, 1.3281, 1.3267, 1.3228, 1.3201 and 1.3165. Here, the descending structure of February 10 is considered as a medium-term. The continuation of movement to the bottom is expected after the breakdown of the level of 1.3228. In this case, the target is 1.3201. Price consolidation is near this level. The breakdown of the level of 1.3200 will lead to the development of pronounced movement to the bottom. Here, the potential target is 1.3165. We expect a pullback to the top from this level.
Short-term upward movement is possibly in the range of 1.3267 - 1.3281. The breakdown of the latter value will lead to an in-depth correction. Here, the target is 1.3303. This level is a key support for the downward structure.
The main trend is the formation of medium-term initial conditions for the downward movement of February 10
Trading recommendations:
Buy: 1.3267 Take profit: 1.3281
Buy : 1.3283 Take profit: 1.3303
Sell: 1.3226 Take profit: 1.3203
Sell: 1.3199 Take profit: 1.3167
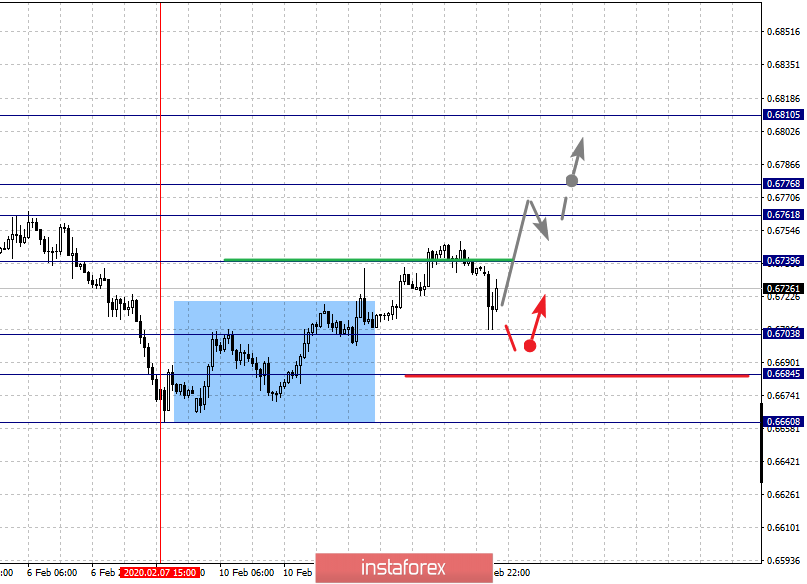
For the Australian dollar / US dollar pair, the key levels on the H1 scale are : 0.6810, 0.6776, 0.6761, 0.6739, 0.6703, 0.6684 and 0.6660. Here, we are following the development of the ascending structure of February 7. The continuation of the movement to the top is expected after the breakdown of the level of 0.6740. In this case, the target is 0.6761. Short-term upward movement, as well as consolidation is in the range of 0.6761 - 0.6776. For the potential value for the top, we consider the level of 0.6810. Upon reaching which, we expect a pullback to the bottom.
Short-term downward movement is possibly in the range of 0.6707 - 0.6731. Hence, there is a high probability of a reversal to the top. The breakdown of the level of 0.6684 will lead to the formation of a downward structure. Here, the potential target is 0.6660.
The main trend is the upward structure of February 7
Trading recommendations:
Buy: 0.6740 Take profit: 0.6761
Buy: 0.6762 Take profit: 0.6775
Sell : 0.6703 Take profit : 0.6687
Sell: 0.6682 Take profit: 0.6660
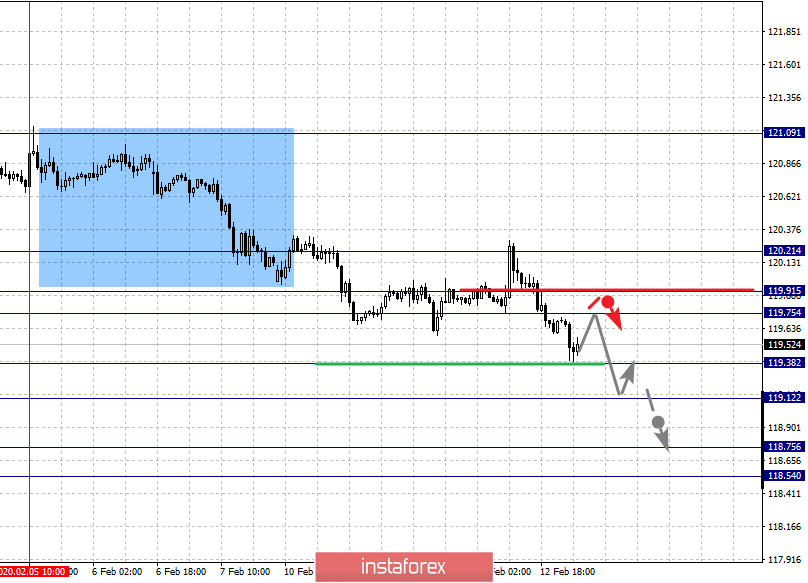
For the euro / yen pair, the key levels on the H1 scale are: 120.21, 119.91, 119.75, 119.38, 119.12, 118.75 and 118.54. Here, we are following the descending structure of February 5. Short-term downward movement is expected in the range of 119.38 - 119.12. The breakdown of the latter value will lead to the development of a pronounced downward movement. Here, the goal is 118.75. For the potential value for the bottom, we consider the level of 118.54. Upon reaching which, we expect consolidation in the range of 118.75 - 118.54, as well as a rollback to the top.
Short-term upward movement is possibly in the range of 119.75 - 119.91. The breakdown of the last value will lead to an in-depth correction. Here, the goal is 120.21. This level is a key support for the downward structure.
The main trend is the descending structure of February 5
Trading recommendations:
Buy: 119.75 Take profit: 119.90
Buy: 119.93 Take profit: 120.21
Sell: 119.36 Take profit: 119.14
Sell: 119.10 Take profit: 118.75
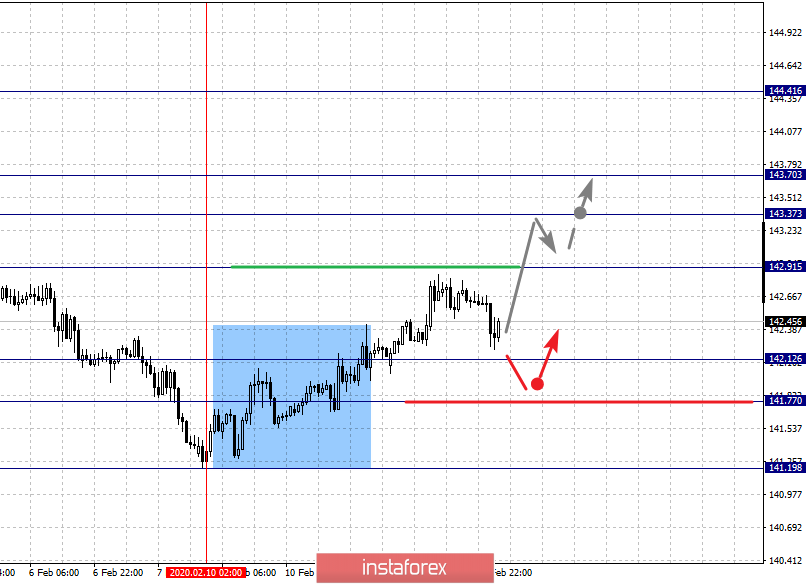
For the pound / yen pair, the key levels on the H1 scale are : 144.41, 143.70, 143.37, 142.91, 142.12, 141.77 and 141.19. Here, we are following the development of the ascending structure of February 10. The continuation of the movement to the top is expected after the breakdown of the level of 142.91. In this case, the target is 143.37. Short-term upward movement, as well as consolidation is in the range of 143.37 - 143.70. The breakdown of the level of 143.70 will allow you to count on movement to a potential target - 144.41, upon reaching this level, we expect a pullback to the bottom.
Short-term downward movement is possibly in the range of 142.12 - 141.77. Hence, the probability of a turn to the top is high. The breakdown of the level of 141.70 will lead to the formation of initial conditions for the downward cycle. Here, the potential target is 141.20.
The main trend is the rising structure of February 10
Trading recommendations:
Buy: 142.91 Take profit: 143.35
Buy: 143.38 Take profit: 143.70
Sell: 142.10 Take profit: 141.82
Sell: 141.74 Take profit: 141.35