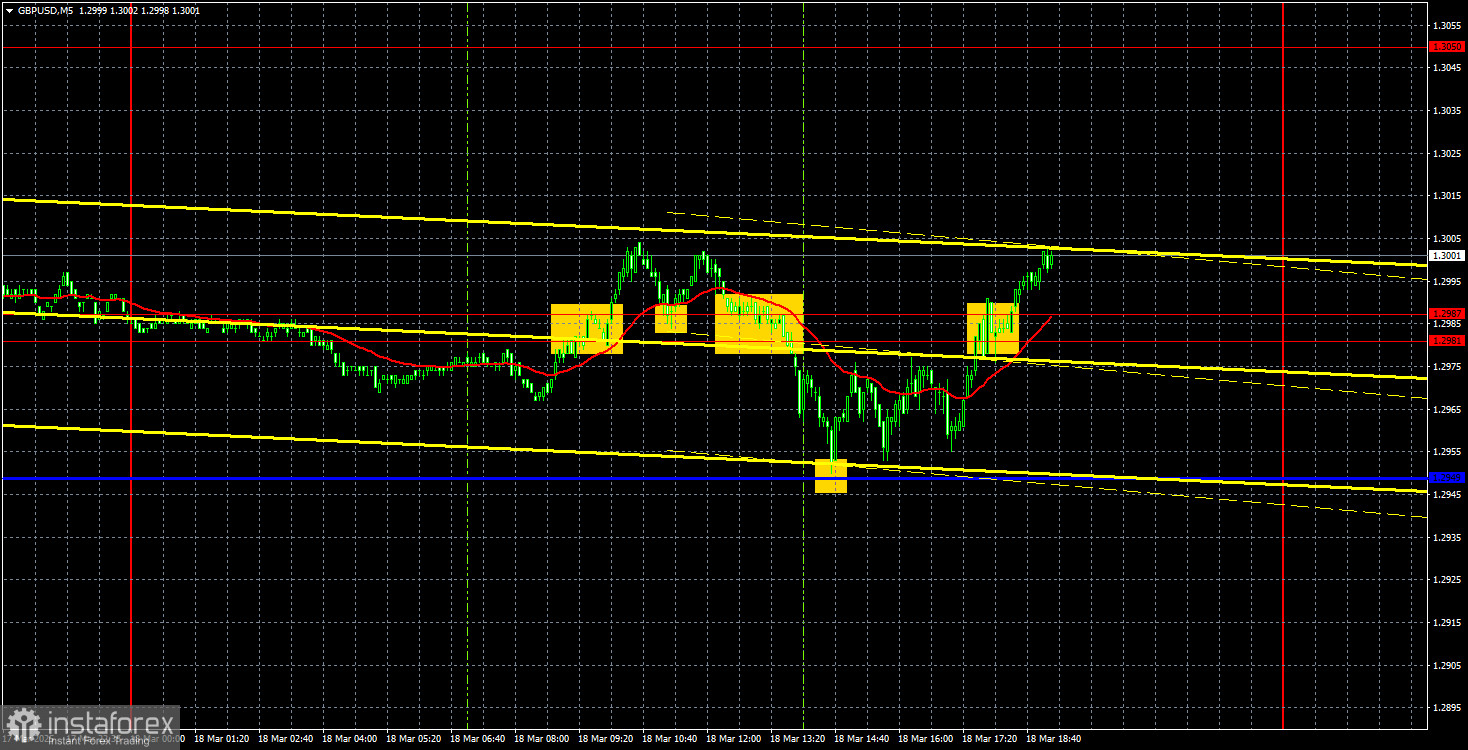
GBP/USD 5-Minute Analysis
The GBP/USD currency pair again showed an upward movement on Tuesday despite having no fundamental reasons. There were no significant events or reports in the UK, and in the second half of the day, strong U.S. reports on industrial production and housing construction were released. However, the dollar only gained about 40 pips for roughly two hours before resuming its decline. That was the extent of the market's reaction to the positive U.S. data—it briefly strengthened the dollar, and then traders resumed selling it. This is all one needs to know about the current market logic.
The Fed meeting will take place today, and tomorrow, the Bank of England will meet. While traders do not expect policy changes from either central bank, important information is still anticipated. The Fed, in particular, will release its "dot plot" chart, which reflects policymakers' expectations for interest rates in the coming years. This chart allows traders to track shifts in the Fed's monetary stance. However, how can the dollar be expected to rise when it fails to do so under any circumstances? The Fed maintains a relatively hawkish stance, yet the dollar remains weak because the market trades solely on Trump-related factors. The same applies to the Bank of England's policy. Even though it has become more dovish in the context of 2025, the British pound continues to rise without any objective justification.
Several trading signals were generated yesterday, but only a rebound from the critical line resulted in a profitable trade. The 1.2981-1.2987 area was ignored throughout the day, and volatility remained low. The first two buy signals were false but at least mirrored each other. The third sell signal helped recover losses from the first trade, and the rebound from Kijun-sen was also profitable, allowing for a small net gain by the end of the day.
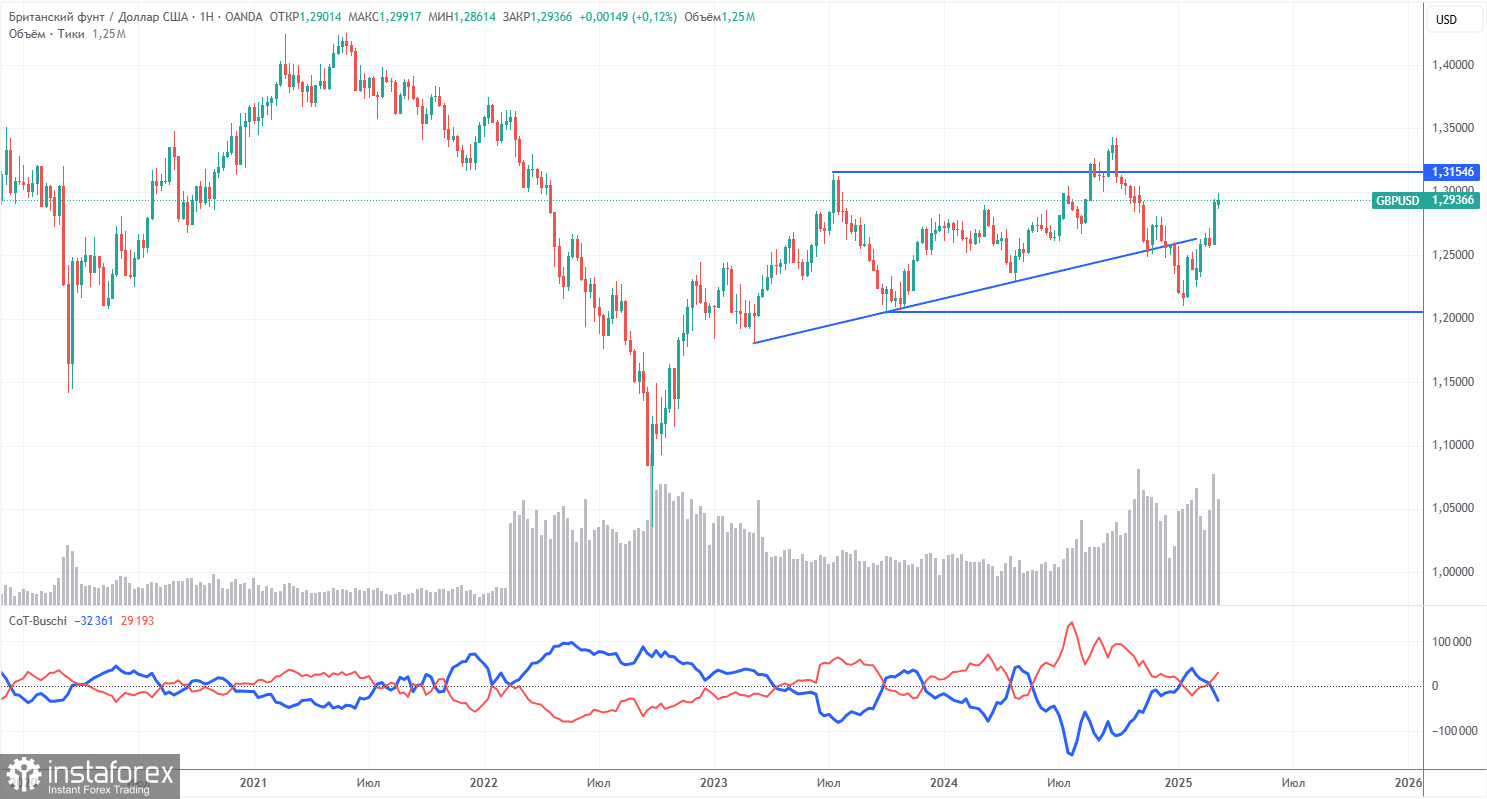
COT Report
COT reports on the British pound indicate that sentiment among commercial traders has been fluctuating over recent years. The red and blue lines, which represent the net positions of commercial and non-commercial traders, frequently intersect and typically hover around the zero mark. Currently, they are close to each other, suggesting a roughly equal number of buy and sell positions.
On the weekly timeframe, the price initially broke through the 1.3154 level before dropping to the trend line, which it subsequently breached. This break suggests that the pound is likely to continue its decline. However, there was also a rebound from the second-to-last local low on the weekly chart, indicating that the market might be entering a period of sideways movement.
According to the latest report on the British pound, the non-commercial group opened 12,900 BUY contracts and 2,300 SELL contracts. Consequently, the net position of non-commercial traders increased by 10,600 contracts over the week.
The fundamental background still does not provide justification for long-term purchases of the British pound. The currency may continue its global downward trend. While the pound has risen significantly in recent times, this increase can be attributed largely to Donald Trump's policies.
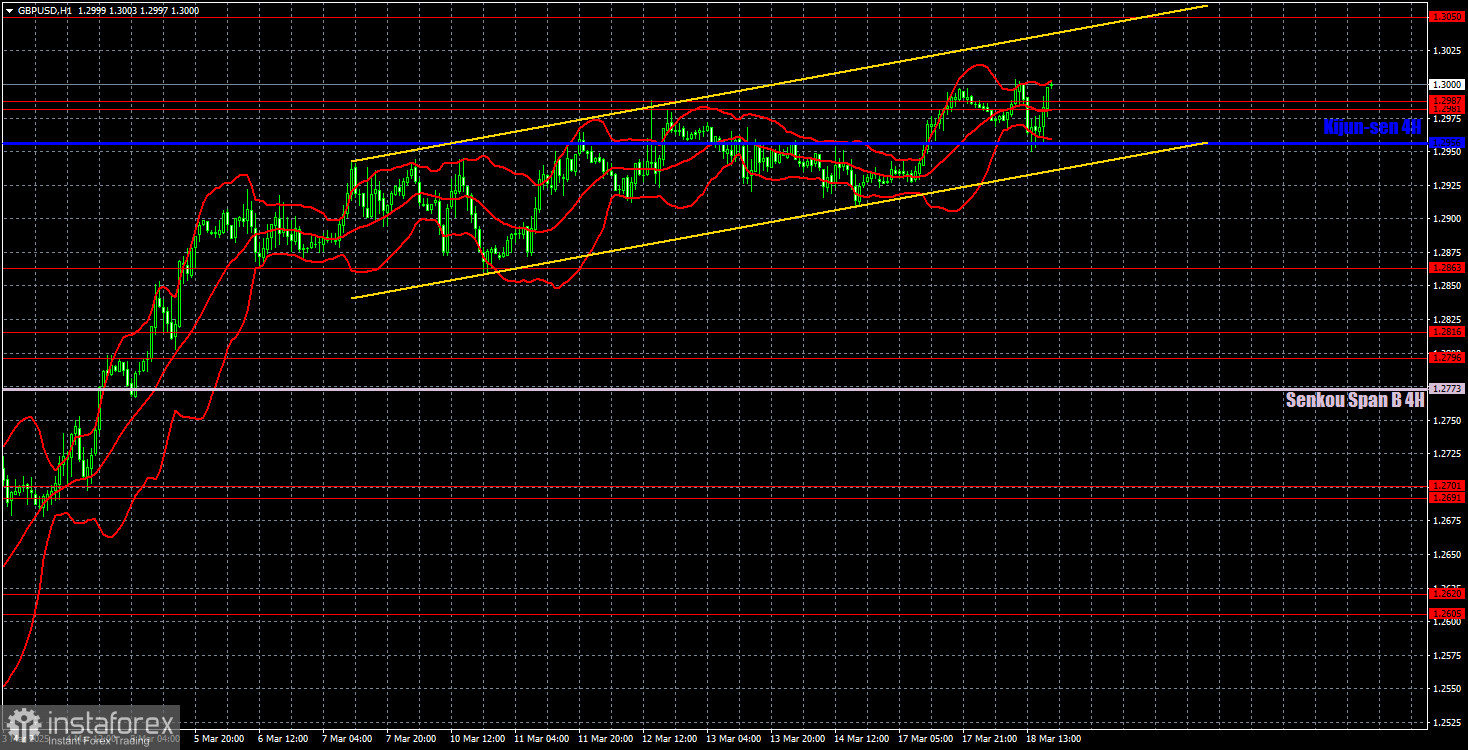
GBP/USD 1-Hour Analysis
In the hourly timeframe, GBP/USD maintains an uptrend, spending several days in a flat phase, and now appears to be resuming its growth. A correction on the daily timeframe is long overdue. We still do not see any long-term justification for the pound's strength. The only supporting factor for the pound is Donald Trump, who continues imposing sanctions and tariffs at will. Even when no new sanctions are announced, the dollar still weakens. The market is ignoring all other factors.
For March 19, the key levels to watch are 1.2331-1.2349, 1.2429-1.2445, 1.2511, 1.2605-1.2620, 1.2691-1.2701, 1.2796-1.2816, 1.2863, 1.2981-1.2987, 1.3050, and 1.3119. The Senkou Span B (1.2773) and Kijun-sen (1.2956) lines may also provide signals. A Stop Loss should be placed at breakeven if the price moves 20 pips in the expected direction. The Ichimoku indicator lines may shift during the day, which should be considered when analyzing signals.
On Wednesday, no significant events are scheduled in the UK, while in the U.S., the Fed meeting, Powell's speech, and the "dot plot" release will occur. The market's reaction to these events is unpredictable, so traders should prepare for sharp price swings in both directions.
Illustration Explanations:
- Support and Resistance Levels (thick red lines): Thick red lines indicate where movement may come to an end. Please note that these lines are not sources of trading signals.
- Kijun-sen and Senkou Span B Lines: Ichimoku indicator lines transferred from the 4-hour timeframe to the hourly timeframe. These are strong lines.
- Extreme Levels (thin red lines): Thin red lines where the price has previously bounced. These serve as sources of trading signals.
- Yellow Lines: Trendlines, trend channels, or any other technical patterns.
- Indicator 1 on COT Charts: Represents the net position size for each category of traders.