GBP/USD
Analysis:
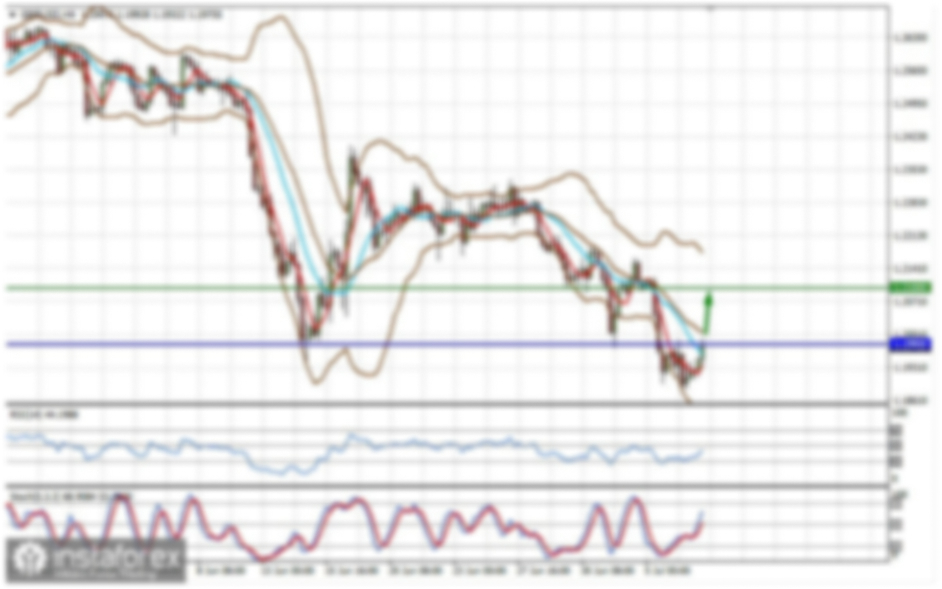
The unfinished wave construction of the major British pound chart can be considered a horizontal descending plane since July 14 of the previous year. On the instrument's chart, it forms a "pennant" pattern. The wave corrects the previous trending segment and is close to completion. The pair's price is trapped in a narrow corridor between opposing zones.
Forecast:
In the upcoming week, the continuation of the overall sideways movement is expected. An upward vector is more likely at the beginning of the week. Closer to the weekend, a reversal formation and the resumption of the price movement towards the support zone are likely.
Potential Reversal Zones
Resistance:
Support:
Recommendations:
Buying: These can be used with a small lot during individual trading sessions.
Selling: This will be possible after confirmed reversal signals appear in the resistance zone.
AUD/USD
Analysis:
On the chart of the Australian dollar, the overall trend of price movement has been set by a bearish wave since the end of the previous year. In its structure, an opposing correction has been developing in the last month, not yet been completed. The calculated support passes along the upper boundary of a powerful potential reversal zone on a weekly scale.
Forecast:
In the next few days, an upward price retracement is most likely. The upside potential is limited by levels of calculated resistance. Afterward, the pair's price is expected to undergo a reversal and resume its downward movement towards the current exchange rate values.
Potential Reversal Zones
Resistance:
Support:
Recommendations:
Buying: Can be used with a fractional lot in intraday trading, until the first signals of a change in direction.
Selling: This will become a prospective direction after confirmed signals of reversal appear in the resistance zone.
USD/CHF
Analysis:
Price fluctuations of the Swiss franc have not yet exceeded the algorithm of the ascending wave since the end of December of the previous year. Over the past three weeks, quotes have moved in a sideways plane along the resistance zone, forming a correction. The calculated resistance passes along the lower boundary of the potential reversal zone on the large-scale chart.
Forecast:
In the next couple of days, the price is expected to move along the boundaries of the resistance zone. By the end of the week, the probability of a reversal formation and the resumption of a downward vector of movement increases, reaching the boundaries of the calculated support.
Potential Reversal Zones
Resistance:
Support:
Recommendations:
Selling: Premature until confirmed reversal signals appear in the resistance zone.
Buying: Have no potential, are risky, and may result in losses.
EUR/JPY
Analysis:
The unfinished bullish wave of the euro/yen pair started at the end of the previous year. The upward movement led the quotes to a strong resistance zone. In the last two weeks, the price in a sideways plane has formed a corrective part (B).
Forecast:
At the beginning of the current week, a price movement along the support boundaries can be expected. Pressure on the lower boundary is possible. Closer to the weekend, a reversal and the resumption of the price increase can be expected. A breakthrough above the resistance boundaries within the weekly period is unlikely.
Potential Reversal Zones
Resistance:
Support:
Recommendations:
Selling: Have no potential and may be unprofitable.
Buying: This will become relevant for trading after the appearance of corresponding reversal signals around the support zone.
EUR/GBP
Analysis:
Analysis of the 4-hour chart shows that the unfinished wave is directed downward. It counts from the end of the previous year. In the wave structure, the middle part (B) is forming predominantly in a sideways plane. The price continues its fluctuations within a corridor between the nearest zones in opposing directions.
Forecast:
In the coming week, the continuation of the overall sideways movement is expected. In the next few days, a downward vector is more likely. Pressure on the lower boundary of support is not excluded. In the following days, a reversal and the resumption of exchange rate growth can be expected, up to the resistance zone.
Potential Reversal Zones
Resistance:
Support:
Recommendations:
Selling: Have a small potential and carry a high level of risk.
Buying: This can be used in trading after the appearance of confirmed signals of reversal around the support zone.
US dollar index
Analysis:
The direction of movement of the US dollar index since the end of the previous year sets the algorithm for an ascending trend. Within it, quotes have formed a corrective elongated plane over the past three months. The quotes are at the lower boundary of a powerful resistance zone. There are no signs of an imminent change in direction on the chart.
Forecast:
Throughout the upcoming week, the completion of the current upward trend is expected. In the area of calculated resistance, a reversal formation can be expected. The beginning of the decline can be expected either at the end of the week or in the next weekly period.
Potential Reversal Zones
Resistance:
Support:
Recommendations
Buying: A brief period of strengthening of the North American currency is expected.
Sells: After the appearance of corresponding signals from trading systems in the area of calculated resistance, deals to strengthen positions in national currencies in major pairs will become possible.
Explanation: In Simplified Wave Analysis (SWA), all waves consist of 3 parts (A-B-C). The latest unfinished wave is analyzed for each timeframe. Dashed lines indicate expected movements.
Attention: The wave algorithm does not take into account the duration of instrument movements over time!