empty
26.09.2022 12:28 PM
Bitcoin forms a descending triangle pattern: will local bottom be updated?

Bitcoin spent the weekend consolidating within a narrow range. The decline in overall trading activity did not affect the cryptocurrency quotes in any way since the interest of retail investors is at a minimum. Bitcoin starts the new week with the formation of a dangerous bearish pattern near the $18.9k level.

After a powerful market crash on September 13 and the formation of one of the largest bearish candles in recent times, BTC/USD has taken a downward direction. On the daily chart of the cryptocurrency, we see a gradual narrowing of the range of fluctuations, which can have far-reaching consequences.

Is the market preparing to sink to the bottom?

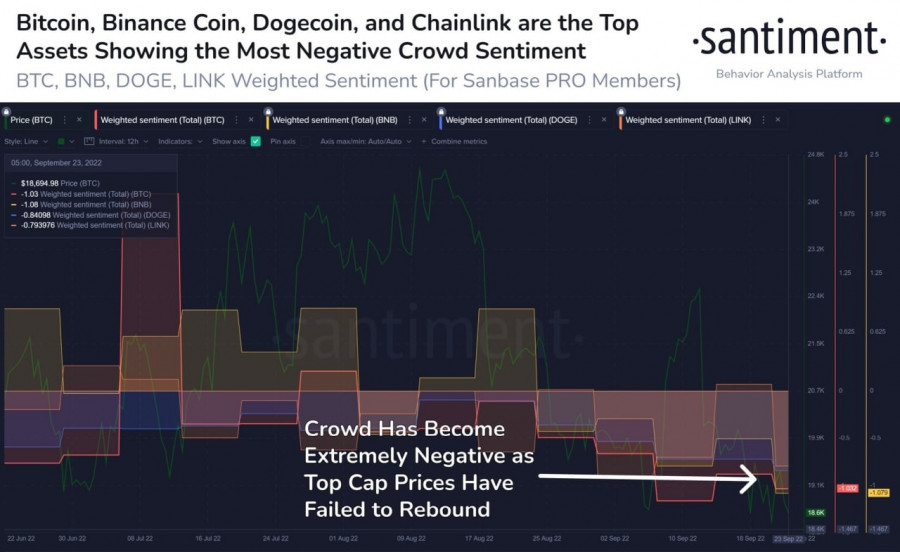
On September 22, buyers formed large volumes and converted them into a green candle. However, it was not possible to develop local success in the future. An unsuccessful attempt to carry out a local rebound exacerbated market sentiment. According to the Santiment report, the cryptocurrency market is experiencing extreme negative sentiment due to failed rebound attempts.

This image is no longer relevant

This leads investors to take concrete action to protect their interests near or below the local low at $17.7k. Each unsuccessful attempt to rebound leads to the saturation of the zone under the local bottom with liquidity. And judging by the price action on the daily chart, the market is gearing up to harvest below $17.7k.

Bitcoin Technical analysis

On the daily chart of BTC/USD, the price is tightening and a descending triangle pattern is forming. The breakdown of this figure will likely be a breakdown of the $17.7k level and an update of the local bottom.

Buying volumes are at their lowest level in the current bear market. Another increase in the key rate is forcing investors to sell their assets in order to avoid margin calls. The result is an ideal situation to update the local bottom and collect large amounts of liquidity below $17.7k.

The formation of a descending triangle may become a prerequisite for a subsequent update of the market bottom. Technical indicators generally show a lull, but, most likely, bearish pressure will resume with the opening of US markets.

Last week, the stochastic oscillator managed to break out of the oversold zone, but subsequently the metric again fell below the 20 level. This is another clear evidence of the weakness of the buyers and the lack of volume needed to protect $17.7k.

S&P 500 Analysis

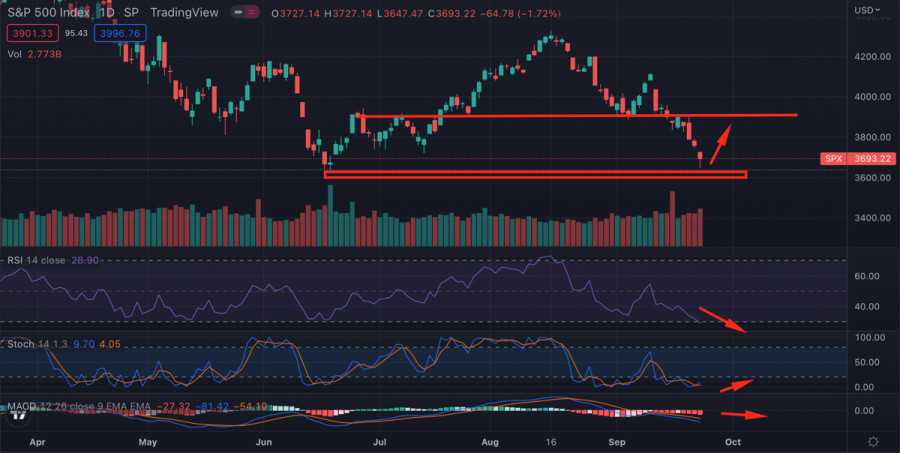
SPX continues to fall and reaches the key support zone at $3,640. Near this level, there are signs of activation of buyers. The bulls managed to move the price away from the important level and as of September 26, the index is trading near $3,700.

This image is no longer relevant

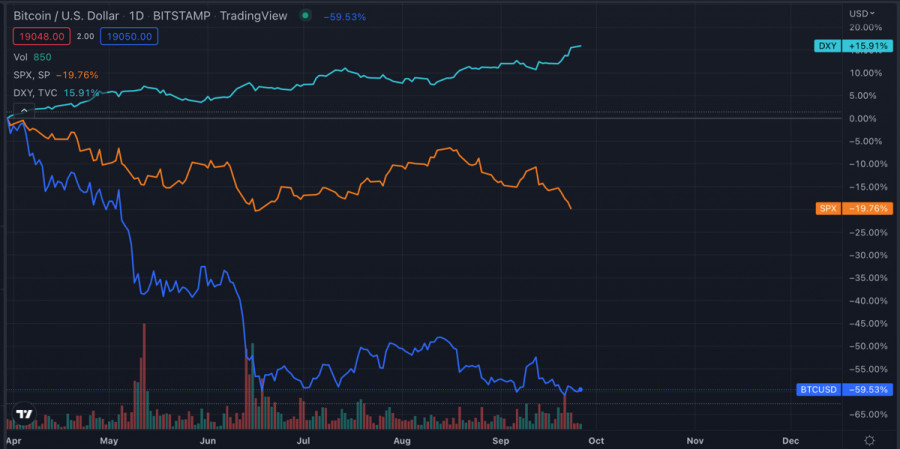
It is important to note that over the past few days, the correlation between Bitcoin and SPX has cracked. The stock index continued to decline while the cryptocurrency stubbornly resisted and remained in a tight range. Judging by the successful rebound of SPX, it will become clear in the near future whether BTC will follow the stock index in an upward movement.

DXY Analysis

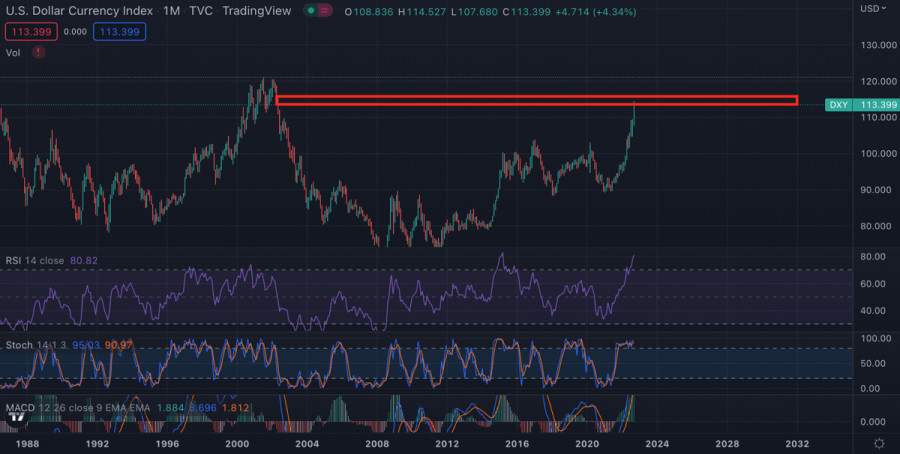
An interesting situation arose with the US dollar index. The asset peaked at 114.5 but subsequently faced increased selling pressure. On the monthly chart, we see that the price has almost reached the high of 2003–2004.

This image is no longer relevant

The technical metrics of the asset on the monthly chart are deep in the overbought zone. It is likely that we will soon face a serious correction in the DXY index, as the asset has reached an absolute peak in all indicators.

Conclusions

There is a high probability that Bitcoin will update the local low in the next two weeks. Technical metrics and another peak moment of negative news have a positive effect on the positions of sellers.

This image is no longer relevant

In the medium term, the markets may be overwhelmed by an upward trend. The impending DXY correction will exceed the drop in the price of the index during the month of the summer. In parallel with the corrective movement of the dollar index, the stock and crypto markets updated local highs. It is likely that we will observe a similar picture in the second half of autumn.

Artem Petrenko,
Especialista em análise na InstaForex
© 2007-2025
Selecionar intervalo de tempo
5
min
15
min
30
min
1
hora
4
horas
1
dia
1
s.
Ganhe com as variações das taxas das criptomoedas com a InstaForex.
Baixe o MetaTrader 4 e abra a sua primeira operação.
  • Grand Choice
    Contest by
    InstaForex
    InstaForex always strives to help you
    fulfill your biggest dreams.
    PARTICIPE DO CONCURSO

Recommended Stories

Análise técnica do movimento intradiário de preços da criptomoeda Filecoin, quinta-feira, 27 de março de 2025.

Após romper com sucesso a linha inferior do canal em formato de Rising Wedge (cunha ascendente) no gráfico de 4 horas da criptomoeda Filecoin, e com seu movimento de preço

Arief Makmur 17:10 2025-03-27 UTC+2

Análise técnica do movimento intradiário de preços da Ethereum, quinta-feira, 27 de março de 2025.

Se nos próximos dias não houver um fortalecimento significativo — especialmente se o preço não romper e fechar acima do nível de 2549,05 no gráfico diário do Ethereum — isso

Arief Makmur 17:07 2025-03-27 UTC+2

Análise do BTC/USD. 27 de março. O Bitcoin não tem potencial de crescimento

A estrutura de ondas no gráfico de 4 horas do BTC/USD está bastante clara. Após a conclusão de uma tendência de alta composta por cinco ondas completas, iniciou-se uma fase

Chin Zhao 17:00 2025-03-27 UTC+2

O projeto de lei de regulamentação das criptomoedas nos EUA avança rapidamente.

Os legisladores dos EUA estão avançando rapidamente com propostas para regular os ativos digitais. Em breve, devem votar um projeto de lei sobre stablecoins e uma versão revisada da legislação

Jakub Novak 14:04 2025-03-27 UTC+2

Recomendações de negociação para o mercado de criptomoedas em 26 de março

O Bitcoin e o Ethereum continuam a apresentar crescimento ativo, mas enfrentam desafios para superar os principais níveis de resistência. Ontem, o Bitcoin recuou após atingir US$ 88.400 e está

Miroslaw Bawulski 15:02 2025-03-26 UTC+2

Recomendações de negociação para o mercado de criptomoedas em 25 de março

O Bitcoin e o Ethereum atingiram níveis significativos, mas não conseguiram mantê-los. O Bitcoin subiu para US$ 88.600 antes de recuar e agora é negociado em torno de US$ 86.600

Miroslaw Bawulski 16:37 2025-03-25 UTC+2

Por que a queda do Bitcoin ainda não acabou?

Apesar do recente crescimento do mercado de criptomoedas, projeções mais otimistas e um retorno do Bitcoin à marca de US$ 100.000 ainda parecem irreais no momento. Dados da Glassnode indicam

Jakub Novak 13:35 2025-03-25 UTC+2

Análise da onda do BTC/USD em 24 de março. Bitcoin continua com sua correção

O par BTC/USD conseguiu interromper sua recente queda. O padrão de onda atual agora sugere um potencial de alta de curto prazo para a principal criptomoeda do mundo. A estrutura

Chin Zhao 17:07 2025-03-24 UTC+2

Recomendações de negociação para o mercado de criptomoedas em 24 de março

O Bitcoin e o Ethereum tiveram um aumento notável hoje, após um fim de semana relativamente lento, indicando um apetite crescente por risco por parte dos investidores, mesmo em tempos

Miroslaw Bawulski 16:32 2025-03-24 UTC+2

Bitcoin e Ethereum mostram sinais de recuperação

O Bitcoin e o Ethereum retomam a recuperação após uma pausa dos traders no fim de semana. Embora o movimento recente sugira um retorno do sentimento altista, ainda é cedo

Jakub Novak 14:12 2025-03-24 UTC+2
Não pode falar agora?
Faça sua pergunta no chat.
Widget callback
 

Dear visitor,

Your IP address shows that you are currently located in the USA. If you are a resident of the United States, you are prohibited from using the services of InstaFintech Group including online trading, online transfers, deposit/withdrawal of funds, etc.

If you think you are seeing this message by mistake and your location is not the US, kindly proceed to the website. Otherwise, you must leave the website in order to comply with government restrictions.

Why does your IP address show your location as the USA?

  • - you are using a VPN provided by a hosting company based in the United States;
  • - your IP does not have proper WHOIS records;
  • - an error occurred in the WHOIS geolocation database.

Please confirm whether you are a US resident or not by clicking the relevant button below. If you choose the wrong option, being a US resident, you will not be able to open an account with InstaForex anyway.

We are sorry for any inconvenience caused by this message.