empty
24.06.2022 12:52 PM
Uncertain Rebound and Inflation Data: How Likely Is Bitcoin To Fall Again?

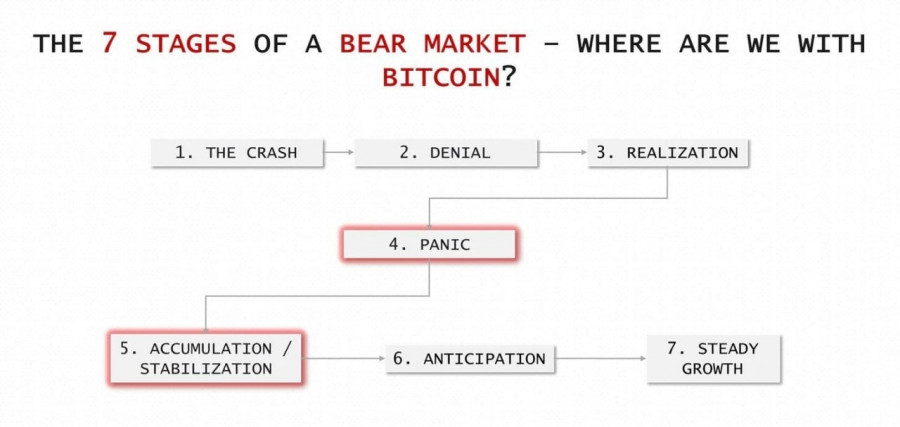
It is safe to say that Bitcoin has gone through one of the most difficult periods in its history. Cryptocurrency has experienced the most massive sell-off and profit-taking in its history. Thus, the asset completed the fifth phase of the bear market, which is called "panic." If we believe this conditional division of the crypto winter into cycles, then we are at the final stage of the global price decline. But despite all the pain and the losses for investors, there are several warning signs that may indicate another attempt to find a local bottom.

This image is no longer relevant

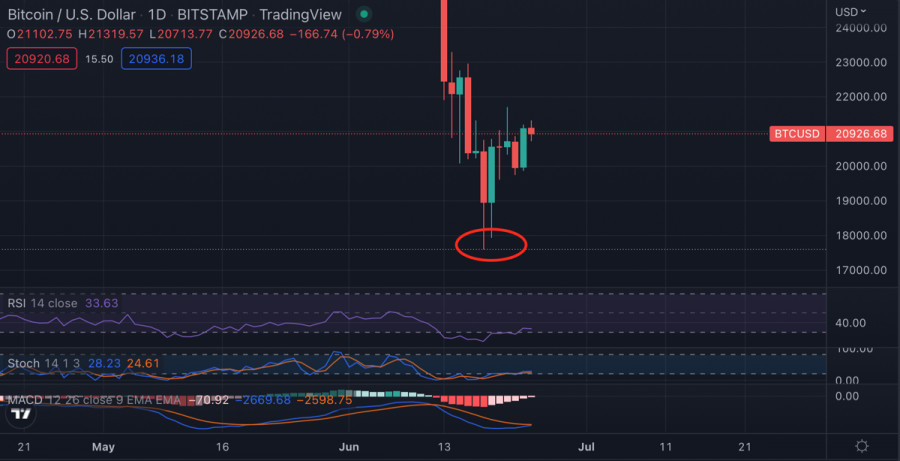
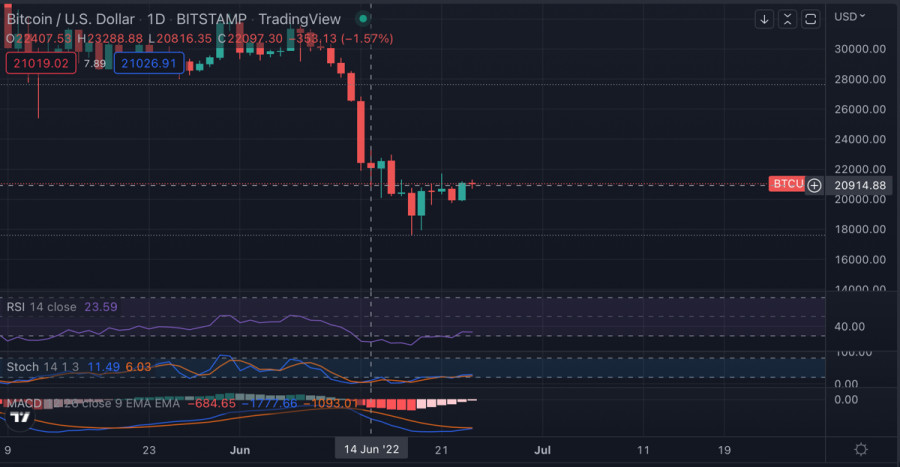
First of all, we are talking about the formation of the current market bottom at $17.7k. On the daily chart, you can see that there was no price rebound as such. Most likely, this should be regarded as the depletion of the downward potential. The volumes of buying activity during reaching the local bottom of the market were at a low level. We didn't see a long lower candlestick shadow like we did in 2021. This suggests that the bears have realized all their goals, and the bulls could not oppose this.

This image is no longer relevant

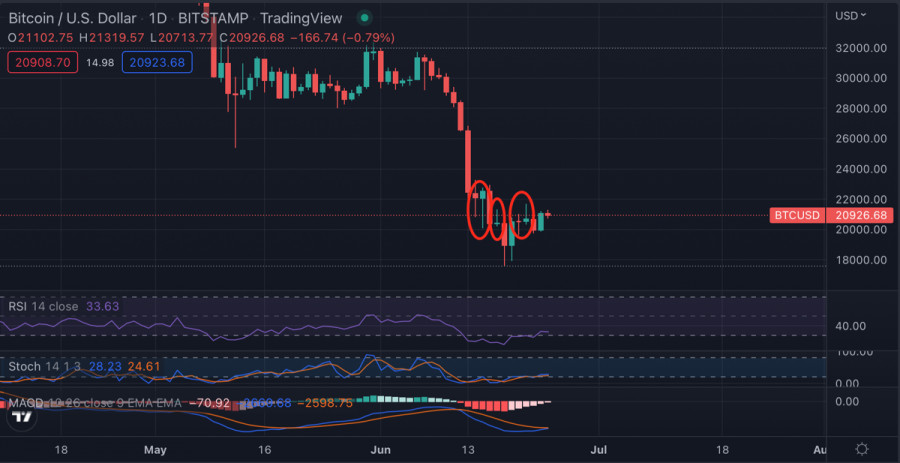
The same can be said about the current period of consolidation. It was not preceded by an active upward correction, which is typical after any strong price movement. Instead, we see hesitant Doji candles with long wicks. All these factors together indicate a complete lack of buying initiative and the volumes necessary for an upward movement. The dynamics and results of the return of BTC/USD above $20k became possible due to the termination of the sale by the miners.

This image is no longer relevant

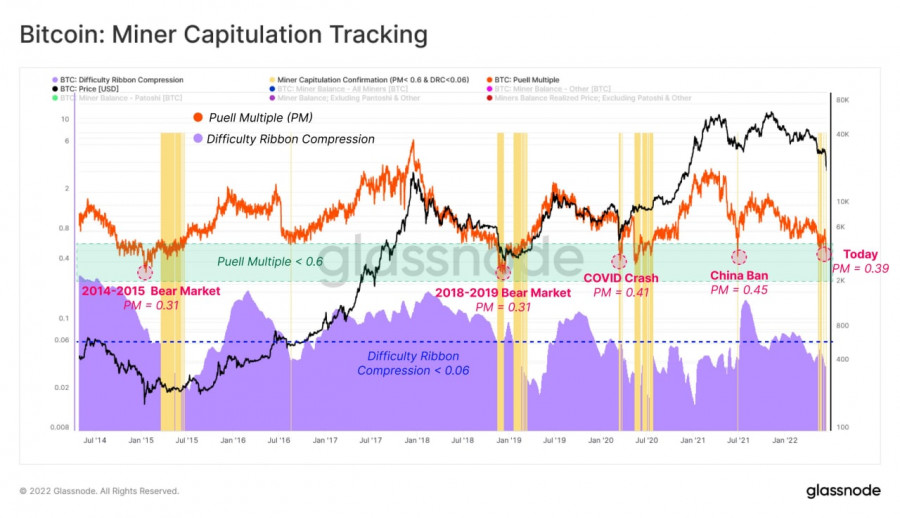
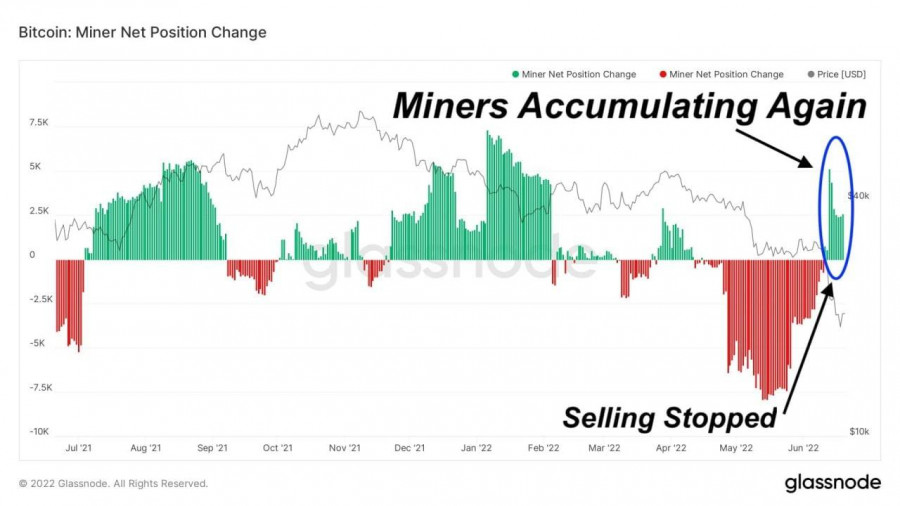
It is no longer a secret to anyone that it was the cryptocurrency mining companies that became the main sponsor of the Bitcoin price drop below $20k. The downward potential of the bears was exhausted, and only the aggravated problems of the miners provided the sellers with the necessary volumes for the price to drop below $20k. Mining firms sold off all BTC accumulated in May 2022.

This image is no longer relevant

In addition, since June 14 alone, companies have sold more than 18,000 Bitcoins, which has been a serious pressure on the price. If you look at the chart, it turns out that it was after June 14 that the price crusade below $20k began. As of June 24, miners have stopped the mass sale, and even resumed accumulation. However, the nature of the rebound from $17k may indicate that the $17k level will not hold if there are repeated problems.

This image is no longer relevant

This image is no longer relevant

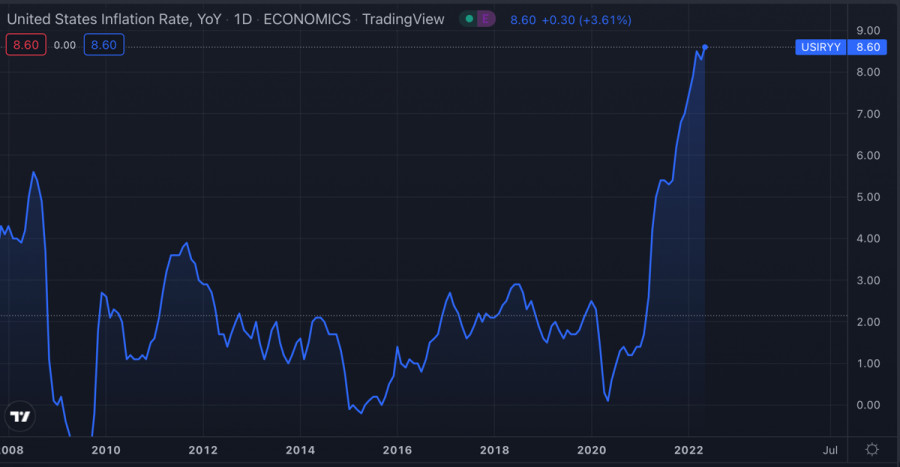
Repeated problems are quite possible already in early July. The main catalyst for the current decline in BTC was just negative data on inflation in the United States. Fed Chair Jerome Powell said at his last meeting that the current rate of inflation growth is forcing the Fed to act tougher, but later we will monitor the indicator and rely on the results when determining the level of the key rate hike.

This image is no longer relevant

After the events of early June, when, contrary to market expectations, it turned out that the Fed does not control the level of inflation, players will closely monitor the level of consumer price growth. With the war in Ukraine continuing and the US announcing new military and economic aid, there is no doubt that inflation is still capable of delivering unpleasant surprises to the market.

This image is no longer relevant

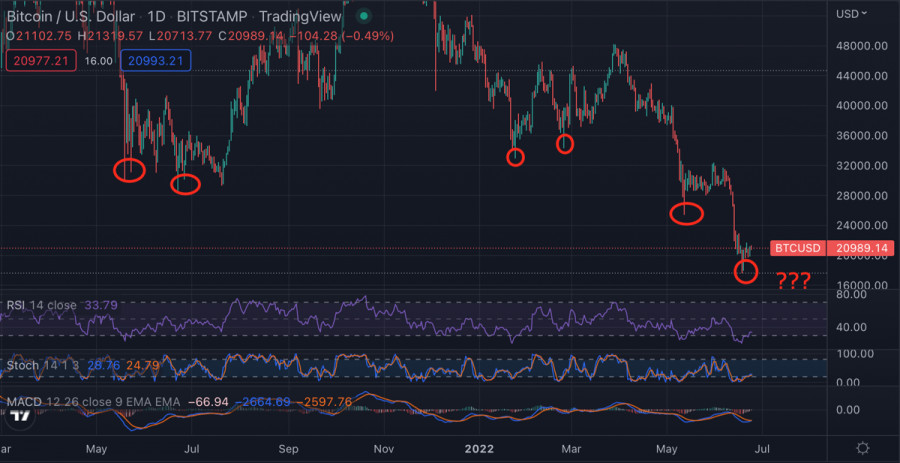
The fundamental and technical features of Bitcoin indicate that the asset can retest $17k, and possibly go lower. However, based on the historical context of the movement of BTC/USD quotes, we can say that the likely decline will be the last in the current bear market. In the history of Bitcoin, there have been many cases when the formation of a local bottom was due to a repeated price decline.

เลือกช่วงเวลา
5
นาที
15
นาที
30
นาที
1
ชั่วโมง
4
ชั่วโมง
1
วัน
1
สัปดาห์
รับผลกำไรจากการเปลี่ยนแปลงอัตราสกุลเงินดิจิทัลกับ InstaForex.
ดาวน์โหลด MetaTrader 4 และเปิดการซื้อขายครั้งแรกของคุณ.
  • Grand Choice
    Contest by
    InstaForex
    InstaForex always strives to help you
    fulfill your biggest dreams.
    เข้าร่วมการแข่งขัน


บทความแนะนำ

การวิเคราะห์ BTC/USD ประจำวันที่ 29 เมษายน 2025

รูปแบบคลื่นบนกราฟ 4 ชั่วโมงของ BTC/USD ดูเหมือนจะซับซ้อนขึ้นเล็กน้อย เราได้สังเกตเห็นโครงสร้างที่กำลังแก้ไขลง ซึ่งเสร็จสิ้นรอบบริเวณระดับ $75,000 หลังจากนั้นได้เริ่มการฟื้นตัวแรงที่อาจเป็นจุดเริ่มต้นของแนวโน้มอื่น ในขณะนี้ คลื่นแรกได้ก่อตัวขึ้นแล้ว ดังนั้นคาดว่าจะมีการแก้ไขเป็นคลื่น 2 หรือ

Chin Zhao 11:30 2025-04-29 UTC+2

บิตคอยน์จะมีมูลค่า $200,000 ภายในสิ้นปี

แม้ว่า Bitcoin ยังคงพยายามที่จะทะลุระดับ $95,000 แต่ Standard Chartered เชื่อว่าในไตรมาสที่สอง สกุลเงินดิจิทัลชั้นนำนี้จะทำสถิติสูงสุดใหม่ใกล้กับ $120,000 โดยมีแรงขับจากการปรับพอร์ตเชิงกลยุทธ์จากสินทรัพย์ในสหรัฐอเมริกา "มีหลายดัชนีที่สนับสนุนมุมมองของเรา: Bitcoin กำลังเข้าสู่ระยะการเติบโตต่อไป" Standard

Jakub Novak 11:09 2025-04-29 UTC+2

คำแนะนำในการซื้อขายสำหรับตลาดสกุลเงินดิจิทัลในวันที่ 29 เมษายน

ผู้ซื้อ Bitcoin และ Ethereum กำลังพยายามควบคุมตลาด — และจนถึงตอนนี้ พวกเขากำลังทำได้ดีพอสมควร อย่างไรก็ตาม สิ่งสำคัญที่ควรสังเกตคือยิ่งเรายังคงอยู่ต่ำกว่า $95,000 ได้ยาวนานเท่าใด และล้มเหลวในการรวมตัวเหนือช่วงนี้ซ้ำๆ โอกาสที่ Bitcoin

Miroslaw Bawulski 08:51 2025-04-29 UTC+2

บิทคอยน์เริ่มต้นการเคลื่อนไหวใหม่: เมื่อไหร่ที่คาดว่าจะถึง $120,000 และที่มากกว่า

หลังจากสัปดาห์ที่เต็มไปด้วยความผันผวน ตลาดคริปโตเคอร์เรนซีก็ดูเหมือนจะหายใจได้โล่งขึ้นเล็กน้อย ดัชนี Fear and Greed ถูกบันทึกไว้ที่ 51 — เป็นเขตที่เป็นกลางอย่างหายาก ซึ่งแสดงให้เห็นว่ากลุ่มตลาดที่พยัคฆ์และหมีเกือบเสมอกัน นี่คือการสมดุลที่ละเอียดอ่อนของความคาดหวัง ที่ตลาดอาจจะเคลื่อนไปได้ทั้งสองทาง การครองความเป็นผู้นำของ Bitcoin

Ekaterina Kiseleva 01:15 2025-04-29 UTC+2

สัญญาฟิวเจอร์ส XRP จะเปิดตัวในวันที่ 19 พฤษภาคม

ในช่วงสุดสัปดาห์ที่ผ่านมา Bitcoin ประสบกับการลดลงในระยะสั้น แต่ไม่นานก็กลับสู่ระดับ $94,000 Ether ก็เผชิญกับแรงกดดันเช่นกัน แต่ก็สามารถรักษาระดับได้อยู่ น่าแปลกใจที่ XRP มีการเพิ่มขึ้นเพียงเล็กน้อยหลังจากที่มีข่าวว่า CME Group ซึ่งเป็นตลาดแลกเปลี่ยนอนุพันธ์ชั้นนำของโลก ประกาศแผนเปิดตัวฟิวเจอร์ส

Jakub Novak 16:14 2025-04-28 UTC+2

คำแนะนำการซื้อขายสำหรับตลาดสกุลเงินดิจิทัลวันที่ 28 เมษายน

Bitcoin กำลังเผชิญแรงกดดัน แต่ยังคงสามารถยืนหยัดได้อย่างมั่นคง หลังจากฟื้นตัวจากระดับ $92,000 สกุลเงินดิจิทัลแรกของโลกกลับมายืนที่ระดับ $94,000 ชี้ให้เห็นถึงแนวโน้มการเติบโตที่ดี ส่วนสถานการณ์ของ Ethereum มีความซับซ้อนมากขึ้น แรงกดดันที่เกิดขึ้นส่งผลให้นักลงทุนขายออกเป็นจำนวนมาก แต่อย่างไรก็ตาม ผู้ซื้อยังสามารถยืนหยัดรักษาระดับได้ในขณะนี้ โดยรวมแล้ว

Miroslaw Bawulski 08:19 2025-04-28 UTC+2

Bitcoin – การวิเคราะห์สถานการณ์ทางเทคนิค

ขณะนี้ ผู้เล่นที่มีทัศนคติเชิงบวกกำลังพยายามเปลี่ยนสถานการณ์และสร้างมุมมองที่ดีสำหรับเดือนเมษายน เมื่อสัปดาห์ที่แล้ว มีการทดสอบแนวต้านที่ระดับสุดท้ายของ Ichimoku cross รายสัปดาห์ (93344) และในกรอบเวลารายวัน ราคาสามารถยืนเหนือระดับนี้ได้ โดยปิดสัปดาห์ในระดับที่สูงขึ้น การขจัด "dead cross" รายสัปดาห์จะเปิดมุมมองใหม่

Evangelos Poulakis 03:51 2025-04-28 UTC+2

คำแนะนำในการซื้อขายสำหรับตลาดสกุลเงินดิจิทัลในวันที่ 25 เมษายน

ความพยายามที่ไม่ประสบความสำเร็จเมื่อวานในการคงระดับเหนือ $94,000 แสดงให้เห็นว่ายังคงมีความสนใจซื้ออย่างมาก Ethereum ก็คงตัวได้ดีเช่นกัน แม้ว่าการปรับฐานระหว่างช่วงการซื้อขายในยุโรปเมื่อวานนี้อาจจะทำให้เกิดความกังวลบ้าง ในขณะเดียวกัน ตามข้อมูลล่าสุด วาฬก็กำลังถอน BTC ออกจากตลาดการแลกเปลี่ยนอย่างต่อเนื่อง แนวโน้มนี้ดำเนินมาเป็นเวลาหลายเดือนแล้ว และตามความเห็นของนักวิเคราะห์ตลาด อาจแสดงถึงกลยุทธ์การสะสมระยะยาวโดยนักลงทุนรายใหญ่ การลดอุปทาน

Miroslaw Bawulski 08:56 2025-04-25 UTC+2

การวิเคราะห์ทางเทคนิคของการเคลื่อนไหวของราคาภายในวันของสกุลเงินดิจิทัล Polkadot ประจำวันศุกร์ที่ 25 เมษายน 2025

ด้วยเงื่อนไขของตัวบ่งชี้ Stochastic Oscillator ที่อยู่เหนือระดับ Overbought (80) แม้ว่าปัจจุบันยังคงเคลื่อนที่อยู่เหนือ WMA (30 Shift 2) ซึ่งบ่งชี้ว่าแนวโน้มยังคงเป็น Bull แต่ตามเงื่อนไขของ Stochastic

Arief Makmur 07:02 2025-04-25 UTC+2

การวิเคราะห์ทางเทคนิคเกี่ยวกับการเคลื่อนไหวของราคาภายในวันของสกุลเงินดิจิทัล Solana, วันศุกร์ที่ 25 เมษายน 2025

แม้ว่าขณะนี้สกุลเงินดิจิทัล Solana จะเคลื่อนที่ในสภาวะที่แข็งแกร่ง โดยมีการเคลื่อนไหวของราคาที่สูงกว่า WMA (30 Shift 2) แต่การปรากฏตัวของ Divergence ระหว่างการเคลื่อนไหวของราคา Solana และตัวบ่งชี้ Stochastic Oscillator

Arief Makmur 07:02 2025-04-25 UTC+2
หากไม่สะดวกคุยในตอนนี้
ระบุคำถามไว้ได้ใน แชท.
Widget callback
 

Dear visitor,

Your IP address shows that you are currently located in the USA. If you are a resident of the United States, you are prohibited from using the services of InstaFintech Group including online trading, online transfers, deposit/withdrawal of funds, etc.

If you think you are seeing this message by mistake and your location is not the US, kindly proceed to the website. Otherwise, you must leave the website in order to comply with government restrictions.

Why does your IP address show your location as the USA?

  • - you are using a VPN provided by a hosting company based in the United States;
  • - your IP does not have proper WHOIS records;
  • - an error occurred in the WHOIS geolocation database.

Please confirm whether you are a US resident or not by clicking the relevant button below. If you choose the wrong option, being a US resident, you will not be able to open an account with InstaForex anyway.

We are sorry for any inconvenience caused by this message.